What We Learned from the Gerrymandering Trial, Day 1
Tues., Jan. 4: Lots and lots of math.
» Day 1 of the Gerrymandering Trial
Here’s what we learned from the first day of the all-important redistricting trial taking place in Wake County Superior Court this week: Nothing. OK, fine. Not nothing. But there weren’t any big reveals for those who’ve been following the gerrymandering saga since time immemorial.
There was, however, a lot of math.
For the plaintiffs, a series of academics testified about very math-y reports (hello, Markov chains!) they authored telling us what was obvious from the get-go: Republicans drew congressional and legislative districts to benefit Republicans.
If the districts they passed last year stand, Republicans will almost certainly win at least 10 of 14 congressional seats and have a good shot at claiming the legislative supermajorities they need to override Governor Cooper’s vetoes.
The most digestible version probably came from Western Carolina University professor (and friend of PRIMER) Christopher Cooper, whose report explains:
North Carolina earned an additional congressional seat because of population growth that occurred mostly in urban areas: according to an analysis of U.S. census data by the News and Observer, more than 78% of North Carolina’s population growth came from the Triangle area and the Charlotte metro area. Despite that fact, the number of Democratic seats actually decreases in the current map, as compared to the last map. The last map produced 5 Democratic wins and 8 Republican wins; this map is expected to produce 3 Democratic wins, 10 Republican wins and 1 competitive seat.
The experts’ biggest hangups with the congressional map were the way Republicans crammed Democratic voters into one deep blue Mecklenberg district and how they cracked the Guilford County into three Republican districts, one skillfully crafted to include Virginia Foxx’s home.
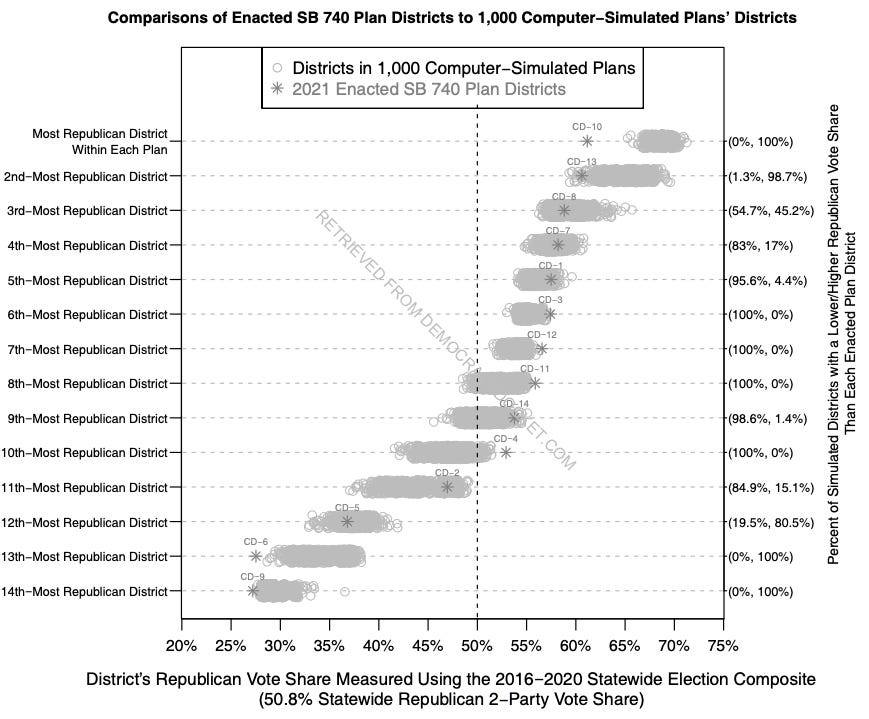
Jowei Chen, a political scientist at the University of Michigan, wrote an algorithm that strictly adhered to the legislature’s professed redistricting criteria while simulating 1,000 redistricting plans for North Carolina’s congressional districts.
97% of his simulation’s maps created districts that guaranteed Republicans fewer than the 10 seats the current congressional map awards them. The most common split was 9–5. But several races were likely to be much more competitive, Chen said. Democrats would face an uphill climb, but not an insurmountable mountain.
No less important, the simulation made the NCGA’s intentions clear:
By randomly drawing districting plans with a process designed to strictly follow nonpartisan districting criteria, the computer simulation process gives us an indication of the range of districting plans that plausibly and likely emerge when map-drawers are not motivated primarily by partisan goals. By comparing the Enacted Plan against the distribution of simulated plans with respect to partisan measurements, I am able to determine the extent to which a mapdrawer’s subordination of nonpartisan districting criteria, such as geographic compactness and preserving precinct boundaries, was motivated by partisan goals.
Every single one of the computer-simulated counterpart districts would have been more politically moderate than [District 9, in Mecklenberg] in terms of partisanship: CD-9 exhibits a Republican vote share of 27.2%, while all 1,000 of the most-Democratic districts in the computer-simulated plans would have exhibited a higher Republican vote share and would therefore have been more politically moderate. It is thus clear that CD-9 packs together Democratic voters to a more extreme extent than the most-Democratic district in 100% of the computer-simulated plans.
I could go on, but the four experts all said much the same thing in different ways:
The Republican maps give a disproportionate advantage to Republicans.
This advantage can’t be attributed to geographic clustering—Democrats living in cities, Republicans sprawling elsewhere—or anything besides partisan intent.
The end result is that Democratic voters are denied representation.
Again: We learned what was already clear. The districts are partisan gerrymanders.
The NCGA’s attorneys—including Tom Farr, who famously helped Jesse Helms suppress Black votes—didn’t really contest that idea. Instead, during cross-examination they mostly picked nits and tried to poke holes in the experts’ statistical designs.
But the finer points of algorithms are secondary to the NCGA’s case. In the legislature’s view, whether the districts are gerrymanders is irrelevant. They believe partisan gerrymandering is constitutional and the court has no power to stop it.
Importantly, the General Assembly never appealed the Wake County Superior Court’s ruling ordering it to redraw districts in 2019, so the state Supreme Court never decided the root constitutional issues.
The Supreme Court gave the Superior Court until Jan. 11—a week from today—to reach a decision. Regardless of what that decision is, the seven SCONC justices, of whom there are four Dems and three Republicans, will ultimately decide the maps’ fate.
While everyone was on vacation, the Court decided it wouldn’t force Justice Phil Berger Jr. to abstain from election-related decisions in which his father, Senate leader Phil Berger, is a named defendant. Justice Berger has to make that call himself.
The decision on North Carolina’s congressional maps has major national implications, of course. A 8-6 map in North Carolina makes it more likely for Dems to hold the U.S. House than an 11-3 or 10-4 map. But the biggest remaining fish is New York, where the legislature could draw anything from 23-3 gerrymander to a 19-7 gift to the GOP.


